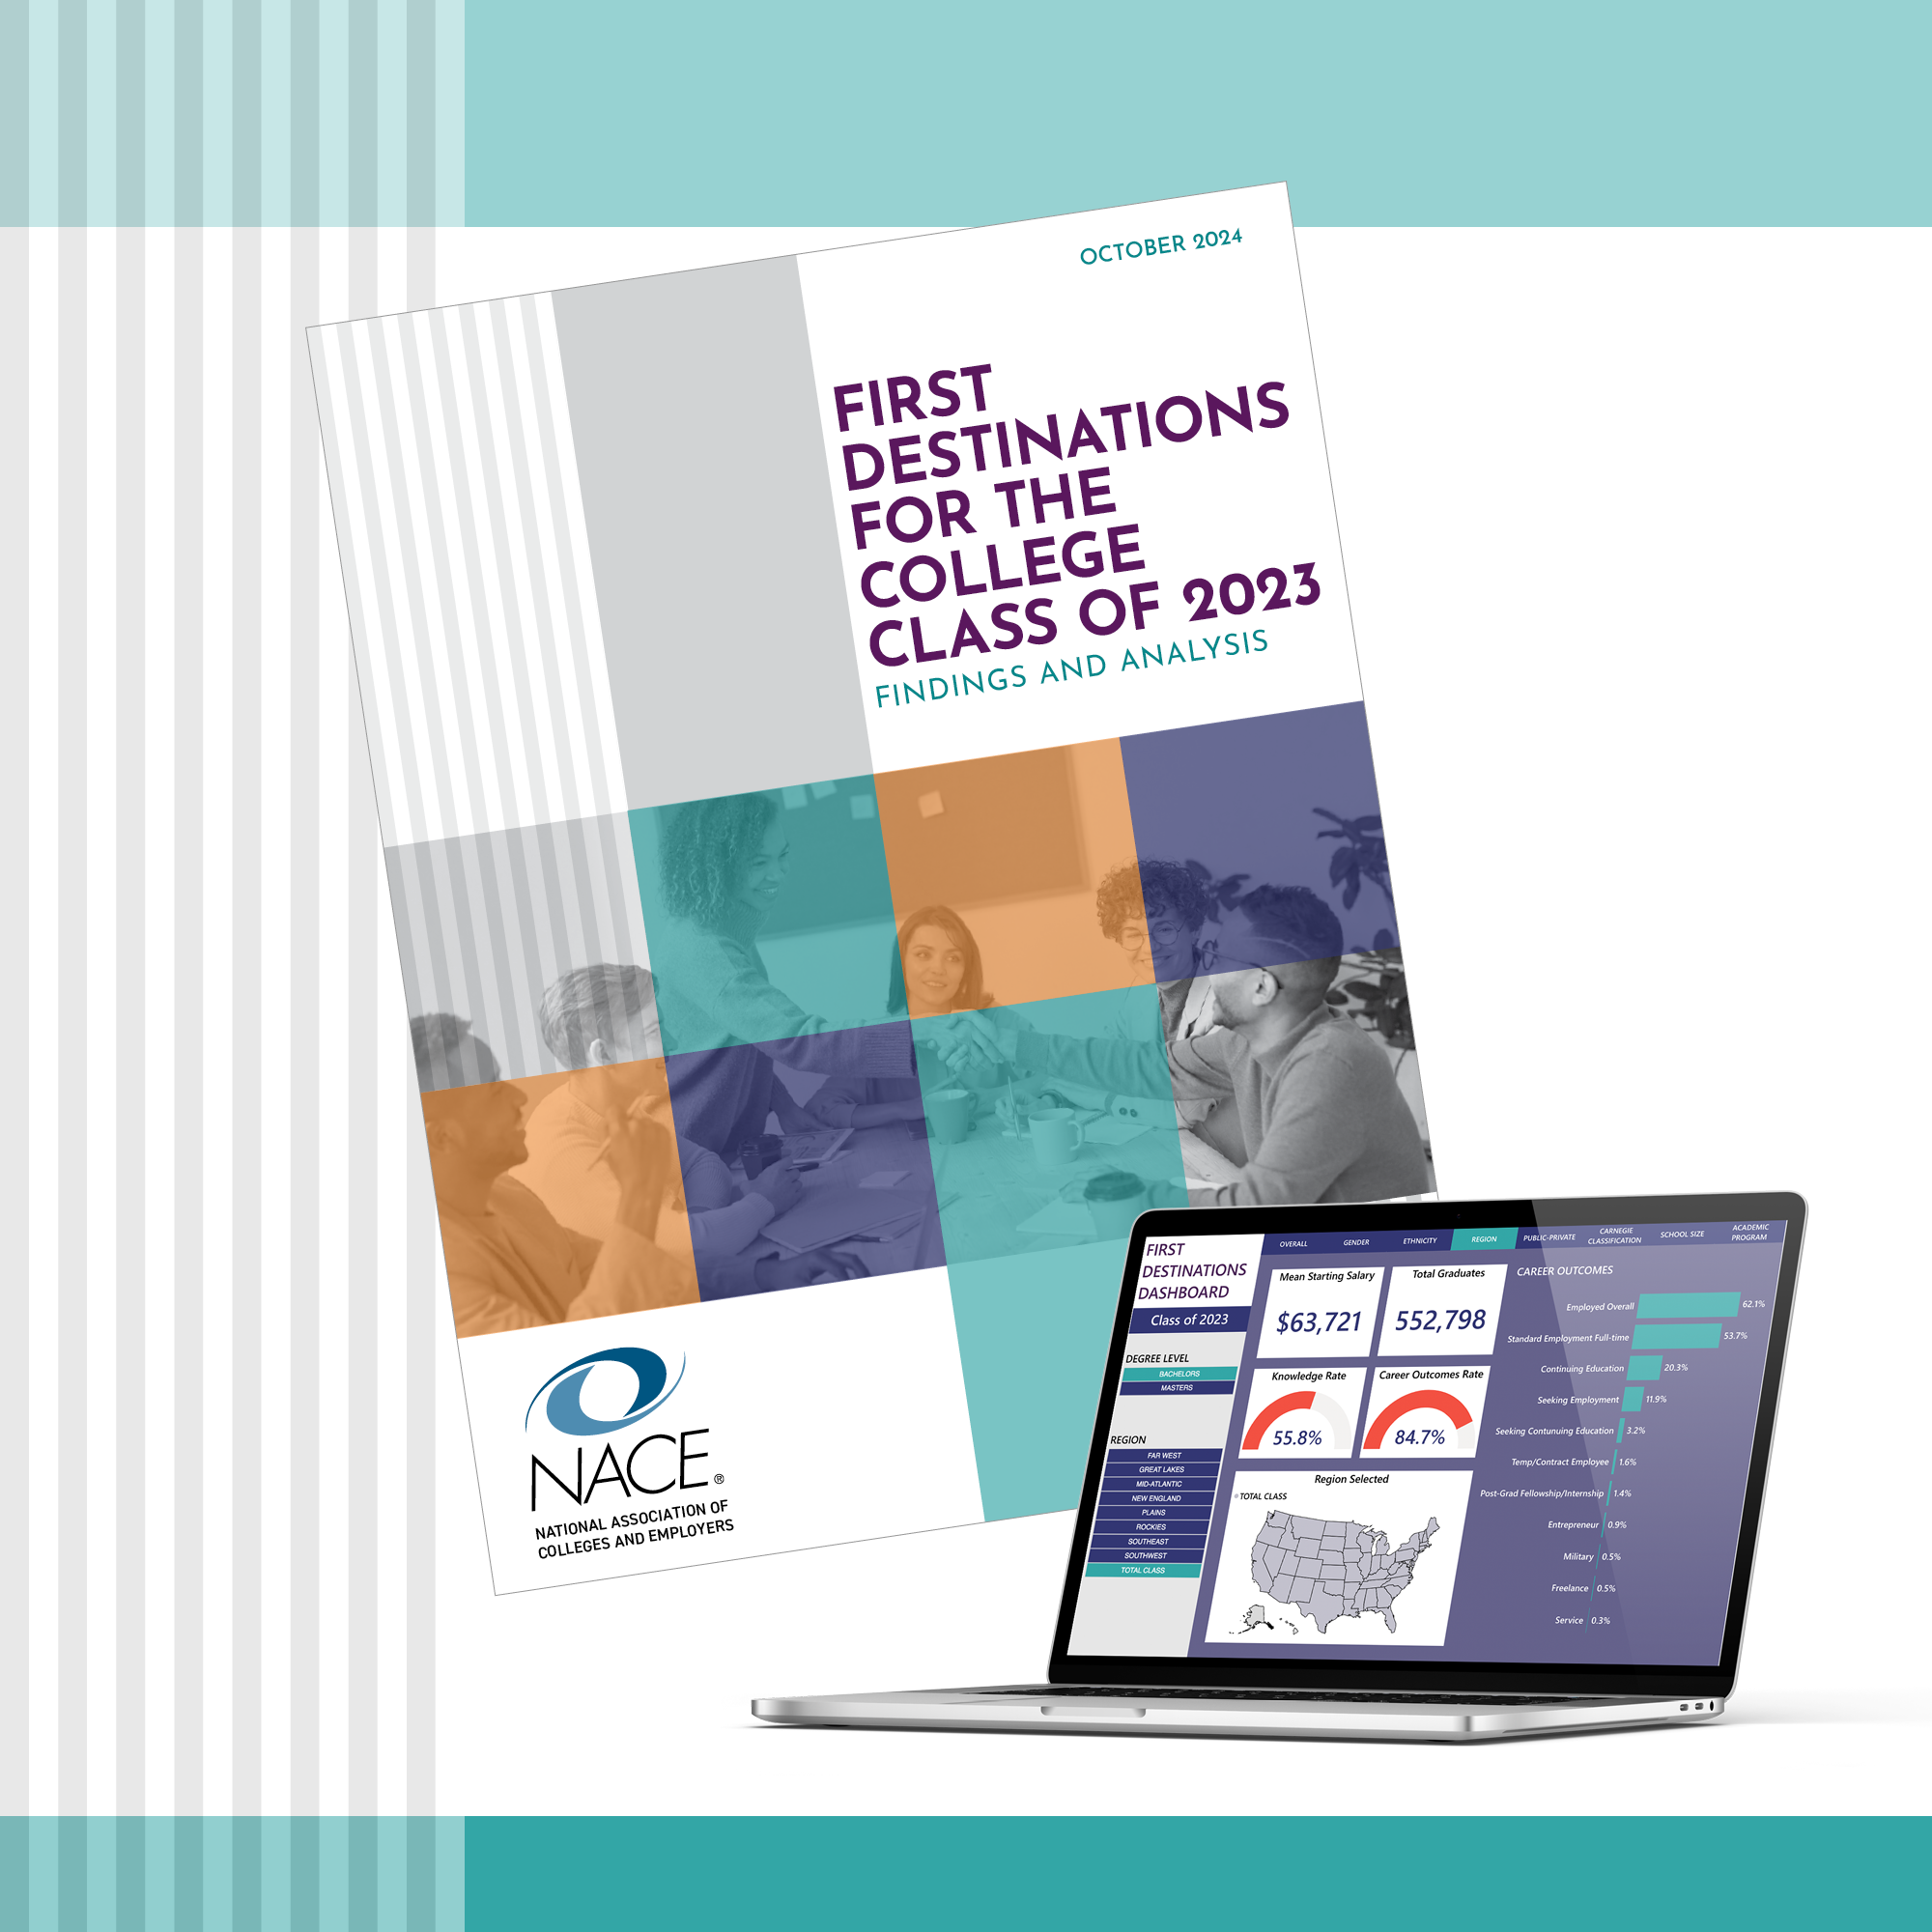
First Destinations for the College Class of 2023

Where did the college Class of 2023 end up after graduation?

The report for the college Class of 2023 provides information about where bachelor’s, master’s, doctoral, and associate degree graduates landed within six months of graduation, and offers the most comprehensive view of graduate outcomes currently available for the Class of 2023.

The report, based on data from 356 colleges and universities nationwide, features employment and other outcomes data for 773,000 graduates:

  • 553,000—28.2%—of all bachelor’s degree graduates,
  • 176,000—18.7%—of all master’s degree graduates,
  • 31,500—15.2%—of all doctoral degree graduates, and
  • 12,500—1.4%—of all associate degree graduates.

The report provides outcomes by degree level, including:
  • employment status (full or part time, contract, freelance, entrepreneur, temporary), plus starting salary data for those employed full time;
  • entrance into military or other service;
  • pursuing further education;
  • still seeking employment or further education; and
  • not seeking employment or further education.

DOWNLOAD THE REPORT

First Destinations for the Class of 2022

First Destinations for the Class of 2023

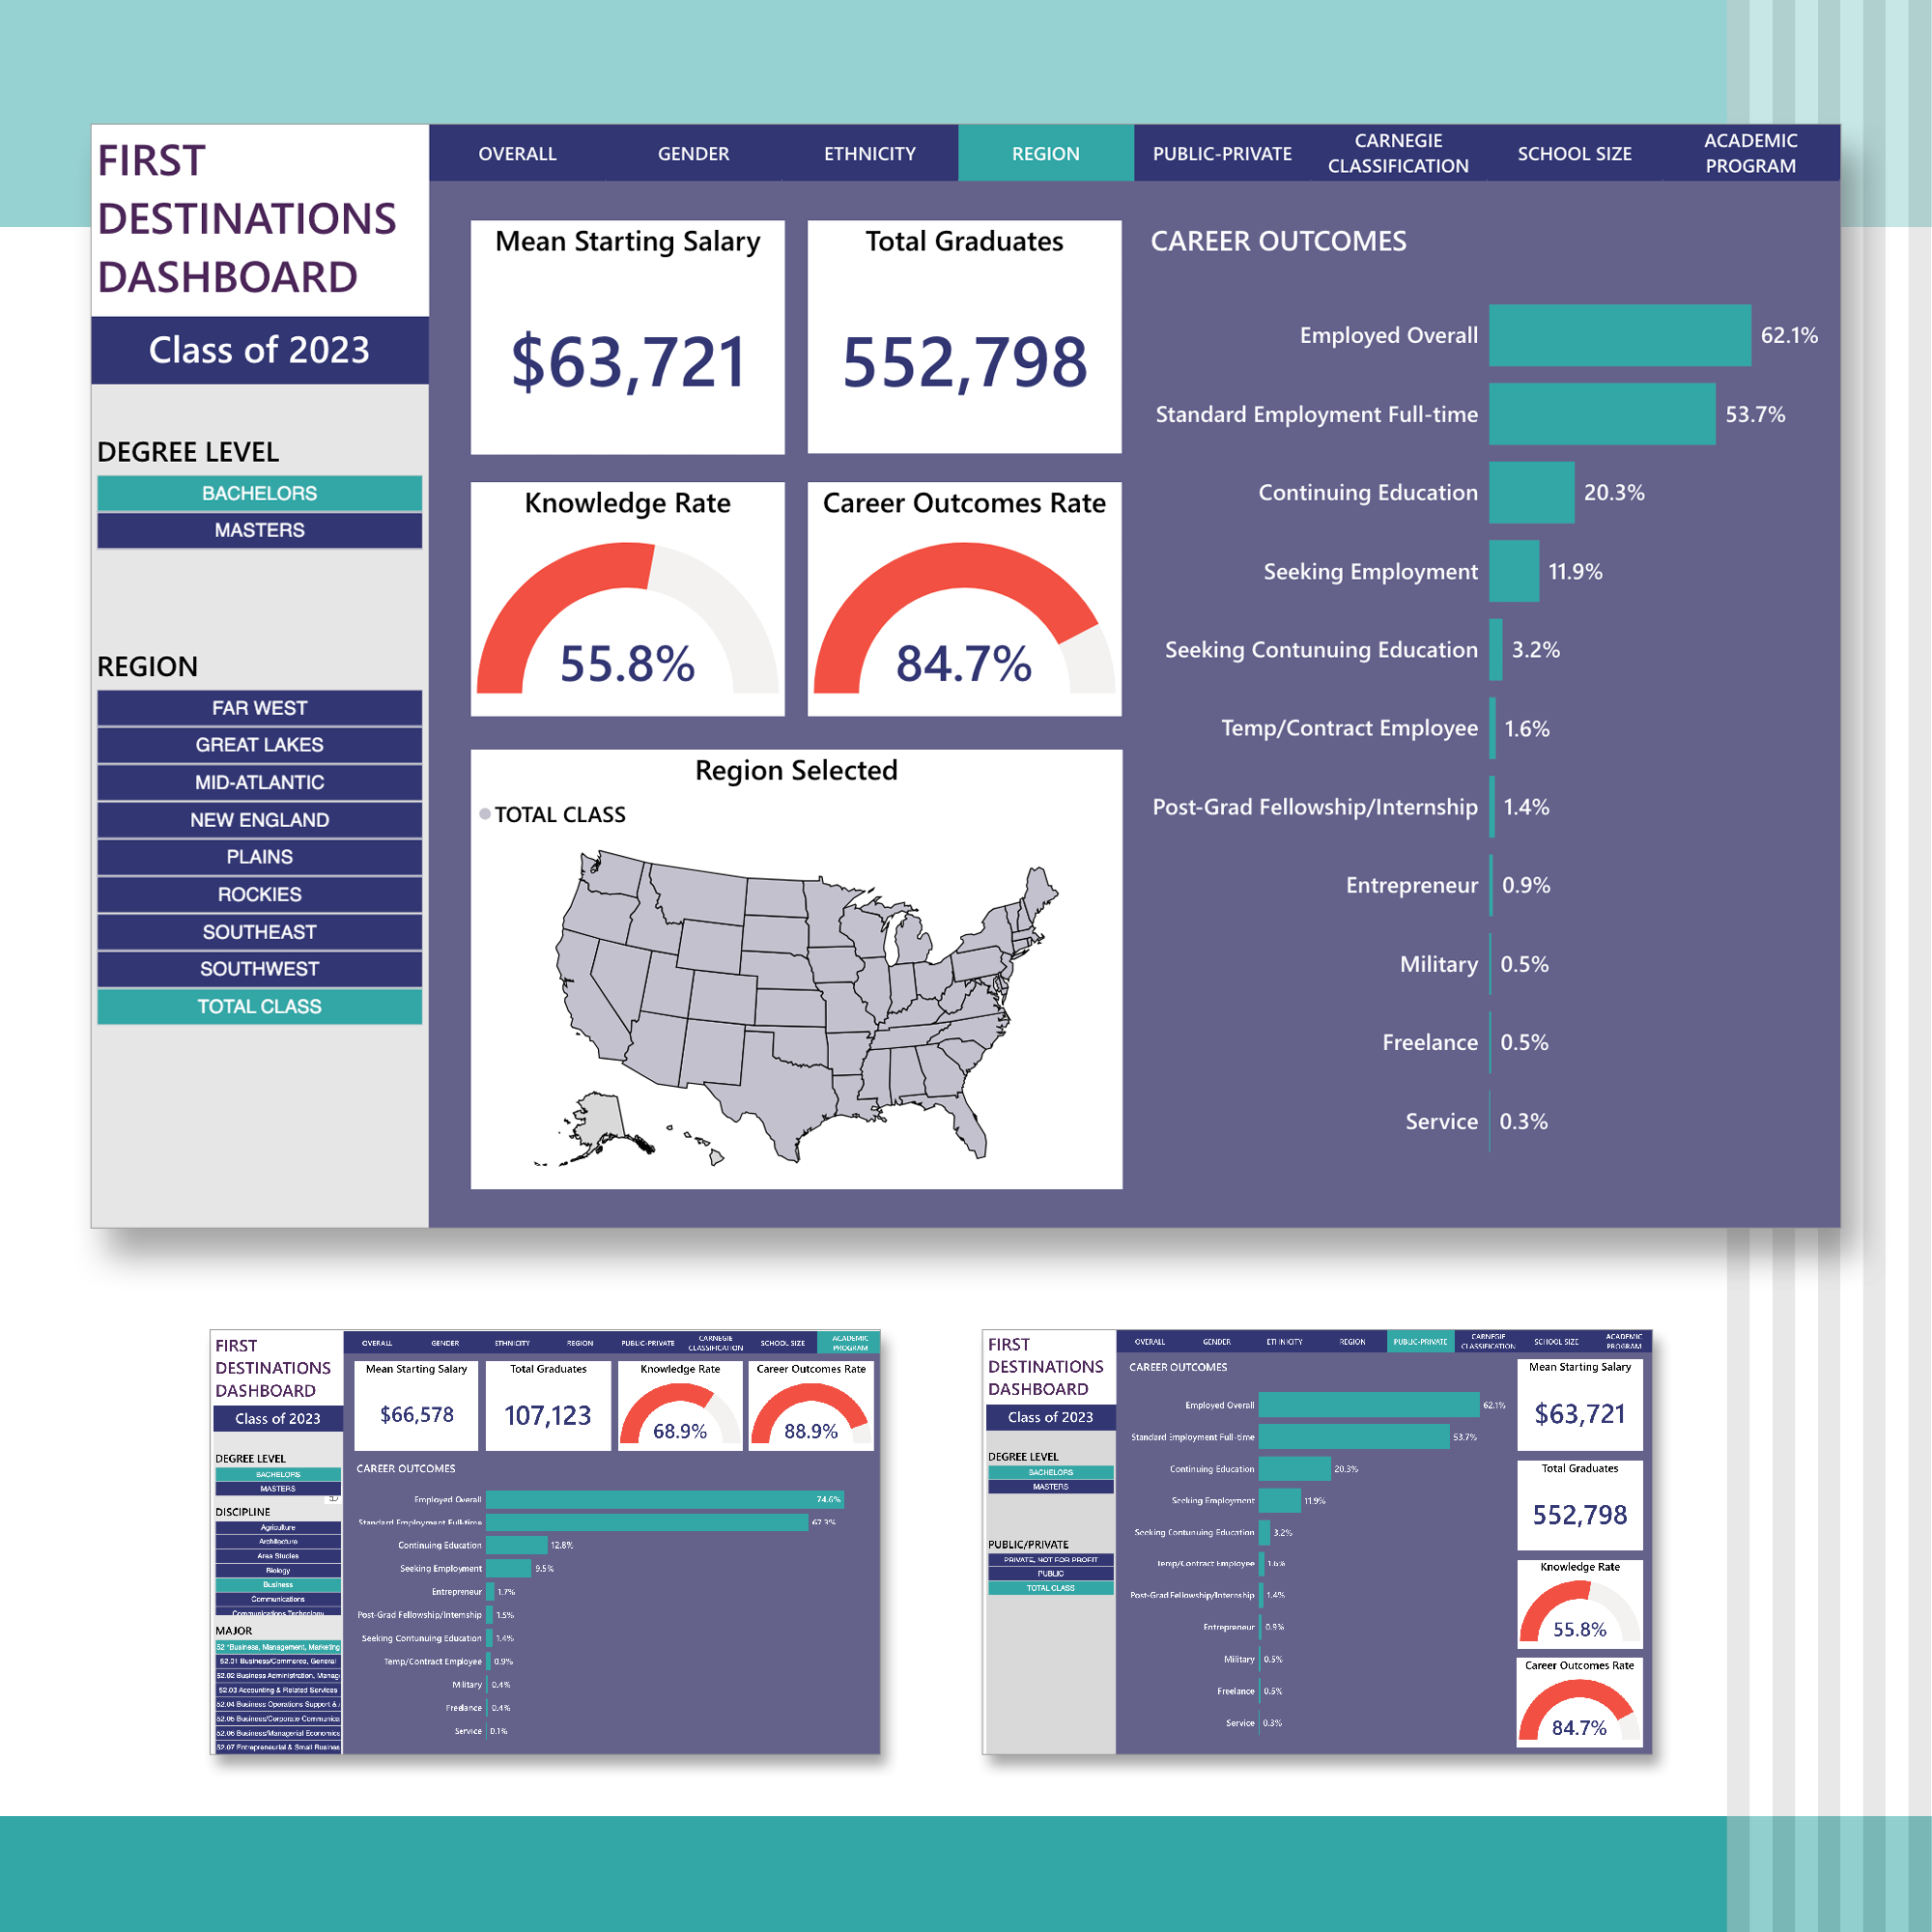
Use the dashboard for detailed outcomes for bachelor’s and master’s degree graduates

Pinpoint data by:

  • Academic program
  • Gender (bachelor’s only)
  • Race/ethnicity (bachelor’s only)
  • Carnegie Classification (bachelor’s only)
  • Region
  • Public vs private institution
  • Size of institution

VIEW DASHBOARD