NACE Journal, February 2015
The period from 2007 through 2013 was a difficult one for new college graduates entering the job market. The unemployment rate for young college graduates (those aged 20 to 24) increased from 5.4 percent in 2007 to just over 10 percent at the height of the labor recession in 2010, and then gradually declined to 8 percent in 2013—a still clearly negative position from before the recession. In addition, many of those who did find employment had to take jobs where the skills and knowledge they accumulated during their college career were not actively used. As a number of analyses have shown, the rate at which new college graduates were underemployed (employed in occupations that did not require a college degree) increased during the recession and still stands at a relatively high level.1
One response to this economic downturn has been to focus more attention on the outcomes of students after they graduate. A number of states have mandated the tracking of graduates in their states to assess the effectiveness of the degree. The Obama administration has created a college “scorecard” to rate schools on their performance in terms of accessibility, graduation rates, and eventually outcomes. The president has also suggested that federal student aid coming to a school will be tied to these ratings.2 In this, the federal government is following the direction of many states: Currently, there are 25 states that tie state dollars to higher education institutions to some form of performance measurement.3
The combination of a difficult labor market and increased scrutiny by all levels of government on the performance of colleges and universities has placed career services offices and career services professionals directly in the crosshairs. Higher education institutions are being forced to pay more attention to the employment and income outcomes of their students than they have ever had to in the past. Career services offices are being held to account for knowing the destinations of graduating students and getting those graduating students into positive landing spots.
Given the increased attention to career outcomes from both government and university administrations, one would expect a significant commitment on the part of the university to the career services office. This commitment could be measured in terms of critical resources expressed as either added dollars or increased personnel to handle the increasing difficulty of counseling students to succeed in a depressed job market.
Using data from two installments of NACE’s annual Career Services Benchmark Survey for Colleges and Universities (2007 and 2014), this article examines the strength of that commitment. The focus will be on three factors—operating budgets, staffing, and salaries. How these resources have evolved since before the recession will be compared to assess how committed universities have become to promoting the positive outcomes of their graduating seniors. To be as clear as possible in assessing trends in the data, the dollar commitments both in terms of nominal dollars will be examined while also controlling for inflation to identify real growth or decline in the university commitment. The trends in terms of the size of the school will be analyzed so that the overall averages because of size differentials are not distorted.
Operating Budgets
Operating budgets do not represent the full financial commitment of the university to career services. However, they are an appropriate indicator of the dollars a career services office has to function with in terms of providing students with information, developing relationships with employers, supporting the professional development of its staff, and underwriting the technology to increase the efficiency of the office. For the most part, the revenues required to meet operating budget demands come directly from the institution itself, although for larger schools, and particularly public institutions, there is an expectation that the career services office will support itself through user fees, both from employers who interact with the university or from the students themselves.
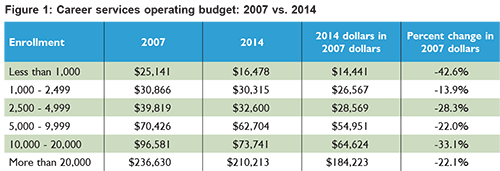
The trend for operating budgets has been decidedly negative, regardless of the size of the school. Schools in all six of the size groups saw decreases in their mean career center operating budgets between 2007 and 2014, both in terms of nominal dollars and most especially in real dollars (controlling for inflation). The smallest schools (fewer than 1,000 students) experienced the most severe decrease, falling from $25,141 in the pre-recession period to only $14,441 (real dollars) in the post-recession period—or a percent change of negative 42.6 percent. Interestingly, while schools with 2,500 or more students saw moderate decreases of negative 22 to negative 33.1 percent, those with 1,000 to 2,499 students saw by far the smallest decrease moving only from $30,866 to $26,567 (adjusted) (-13.9 percent), a rather curious observation. Keep this in mind while reading the following look at career center staffing between 2007 and 2014. (See Figure 1.)
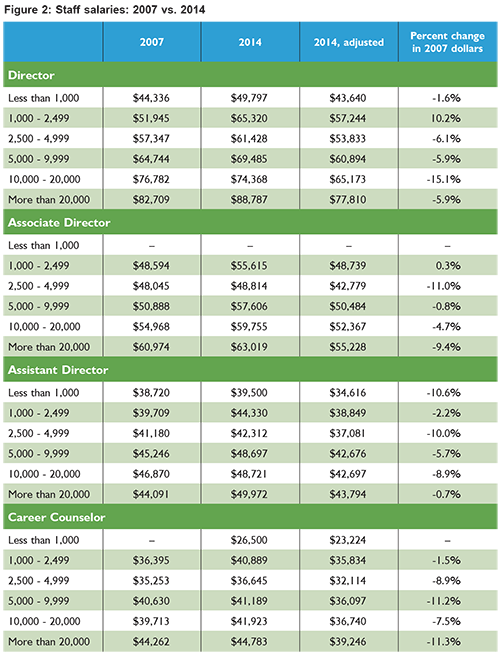
Staffing was looked at in two ways: the annual salaries of career center directors, associate directors, assistant directors, and career counselors and the number of full-time equivalent (FTE) professional staff members. The data trends here are little different than those for operating budgets First, salaries for professional career services personnel, with an anomalous finding here and there, have generally not kept pace with inflation. Directors at schools with 2,500 or more students saw major decreases in their mean salaries (-5.9 to -15.1 percent), shifting their range from $57,347 to $82,709 in 2007 to only $53,833 to $77,810 in 2014 (adjusted for inflation). Meanwhile, directors at schools with fewer than 1,000 students saw a more moderate decrease from $44,336 to $43,640 (adjusted) (-1.6 percent). Schools with 1,000 to 2,499 students again demonstrated curious movement. Between 2007 and 2014, the mean director salary at schools in this group actually increased by 10.2 percent, moving from $51,945 to $57,244 (adjusted) ($65,320, unadjusted). In addition, the mean salaries for associate directors, assistant directors, and career counselors at schools in the 1,000-to-2,499 group remained virtually unchanged (0.3 percent, -2.2 percent, and -1.5 percent, respectively), while in most—but not all—instances, mean salaries for these three positions saw considerable decreases over this seven-year period. (See Figure 2.)
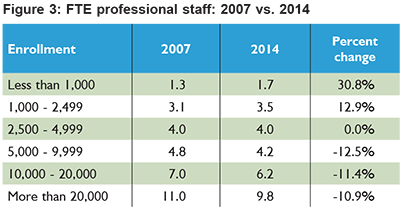
Second, the change in professional staffing levels continues to paint the same general picture, although here the numbers are more ambiguous. Changes in staffing numbers are difficult to objectively interpret. The problem is that the number of FTE professional staff members is so small, in most instances minor changes can yield perhaps misleadingly large percent changes. Nevertheless, the point to note with these data is that there was a clear direction to reduce professional staff among schools with enrollments over 5,000 during this period whereas for smaller institutions the movement was in the opposite direction—an increase in professional staffing. Schools with enrollments between 1,000 and 2,500 students added an average of 0.4 staff members over this period. This results in an increase of 12.9 percent. Schools with fewer than 1,000 students added nearly the same average number of personnel (0.6 professional staff) but the resulting percentage increase was 30.8 percent. In both instances, the absolute difference in personnel amounted to approximately one halftime person. For larger institutions, professional personnel reductions ranged from the loss of one half-time person for schools with enrollments ranging from 5,000 students to those with 20,000. The greatest decline in personnel was for the largest institutions, those with more than 20,000 students. For these universities, the reduction in career services staffing amounted to approximately an average of 1.25 staffers. (See Figure 3.)
Career Services Support vs. College Revenues
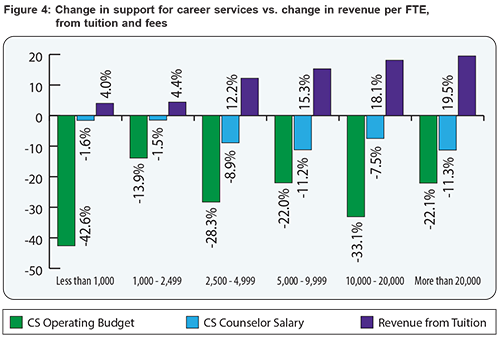
Colleges and universities may suggest that the decreased levels of support for career services are simply a reflection of the difficult economic times that every organization suffered during the past few years. For some, particularly the larger schools that are predominantly public institutions, there is some truth in suggesting economic problems. A cursory examination of revenues from state support by FTE enrollment shows a decrease of 12 percent in nominal dollars—nearly 23 percent when controlling for inflation. However, much of this has been made up through increased tuition and fees from students.
Figure 4 shows the trend in support provided to career services in terms of operating budget and career counselor salary juxtaposed against the change in revenue from tuition and fees from 2007 to 2014. The difference is rather stark. While career services support has decreased for schools at all size levels during this period, revenues from students has increased for schools in all size categories. Some may suggest that this is an indicator that colleges and universities do not see the career development of their students as an especially important priority, if it is a priority at all.
University Support and Career Services Responsibilities
Colleges and universities have been cognizant of the criticisms aimed at higher education when it comes to the employment and income outcomes for their graduates. The universities have responded that a college education is still, on average, a positive outcome for a student that graduates. In this, they are correct. The chances of being employed, regardless of age, are better for an individual holding a bachelor’s degree than someone with just a high school education. In addition, the bachelor’s degree holder will receive a significant boost in lifetime earnings over an individual that does not graduate from college. However, these positive results are being diminished by the fact that both the unemployment rate and the underemployment of recent college graduates are increasing.
Colleges and universities have a responsibility as part of the total education of their graduates to prepare students for eventual entry into the work force. This is a more complex activity than simply providing the student with greater levels of information and even more sophisticated general skills. Career services has a responsibility to educate the student about the nature of the work force and the student’s potential place in it, and how the course of study pursued by the student may eventually affect the student’s place in the work force. Career services should provide the immediate assistance that the graduate may need to maximize his or her capacity to begin a career. In the career center and the career center’s professional personnel, universities and colleges have the vehicles to meet these responsibilities. The problem is that university support for their career centers has not responded to the increased need.
While the support for the student’s career outcomes and objectives from college and university administrations can be clearly called into question because of the meager support provided to their own career centers, government cannot escape its own failings in providing support for their best educated constituents to succeed in the work force. During these years of economic difficulty, state governments have increased their demands on colleges and universities to justify the support being provided to the university by demonstrating the economic success of the university’s graduates. These increased demands have come during a time when these same states have reduced financial support that could have helped the university to increase its career center staff and activities, and given graduates an increased chance for success in the job market.
Career education needs to be an increasingly important part of an institution’s overall “academic” program. The career services center and the career professionals that staff the center have a critical role to play in a student’s career education. College and university administrations need to recognize that changes in the economy will require a more prominent place for career education within their institutions and make it a priority to provide adequate levels of support for their career services offices.
Endnotes
1Tsang, Kenneth C. “Post-Recession Employment for Young College Graduates: A Literature Review,” NACE Journal, February 2014.
2President Barack Obama, “President’s 2013 State of the Union Address,” February 12, 2013.
3National Conference of State Legislatures, “Performance-Based Funding for Higher Education,” March 5, 2014.
Copyright 2015 by the National Association of Colleges and Employers. All rights reserved.

