


Deepen your knowledge with the NACE Class of 2024 Dashboard!
Together, the free First Destinations for the Class of 2024 report and interactive dashboard give you the most comprehensive view of early career outcomes for the Class of 2024—covering data for more than 823,500 graduates. Using the dashboard, you can filter First-Destinations Survey data by academic program, region, public vs. private status, and school size. You can also filter bachelor’s degree data by gender, race/ethnicity, and Carnegie Classification.The graduate outcomes rates for bachelor’s and master’s degree graduates from the Class of 2024 are up, according to NACE’s First Destinations for the College Class of 2024 report.
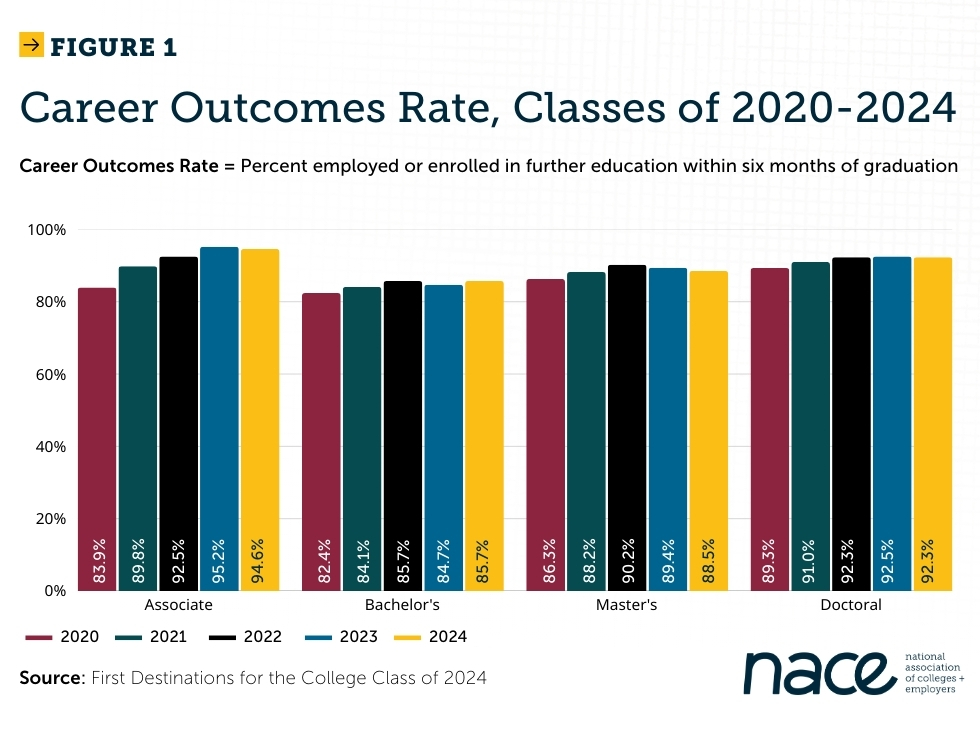
Rising 1.0% from the Class of 2023, 85.7% of Class of 2024 bachelor’s degree graduates were employed or enrolled in further education within six months of graduation. In fact, 2024 graduates in 19 of the 30 academic disciplines analyzed in the report experienced a higher career outcomes rate than their 2023 counterparts.
However, compared with their peers who graduated in 2023, 2022, and 2021, Class of 2024 bachelor’s degree graduates didn’t fare as well in terms of full-time employment: Slightly less than 55% reported full-time employment within six months of graduation, down from more than 57% of 2023 graduates. (See Figure 1.)
Meanwhile, with an overall career outcomes rate* of 88.5%, Class of 2024 master’s degree graduates surpassed their undergraduate peers, but not their Class of 2023 (89.4%) or 2022 (90.2%) counterparts.
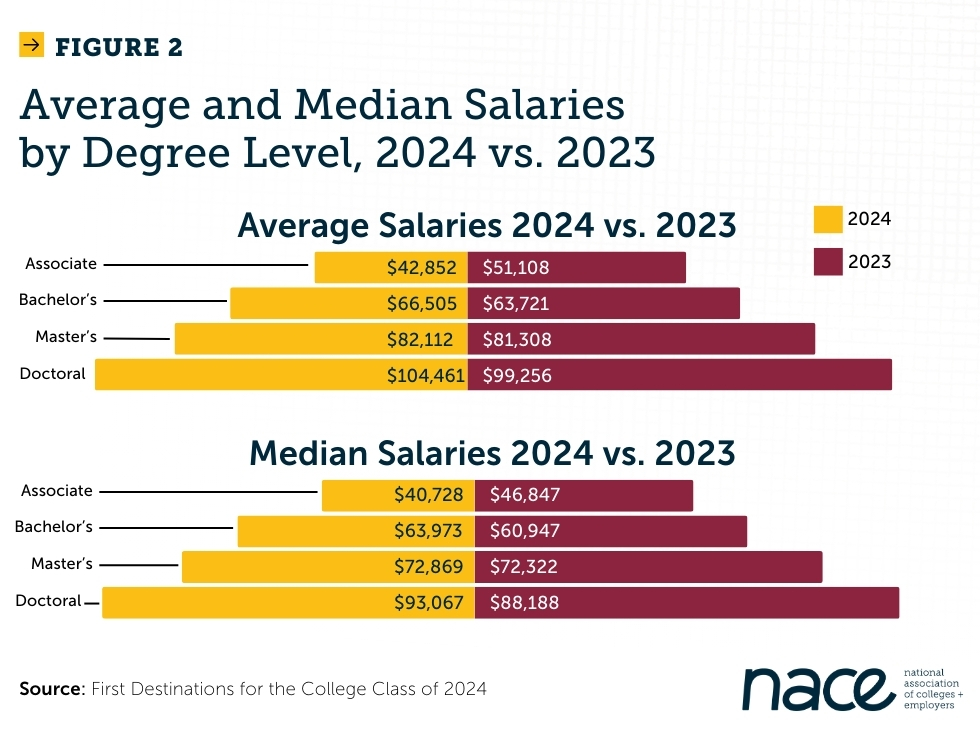
Average and median salaries increased for bachelor’s graduates over the Class of 2023, while average and median salaries for master’s grads saw smaller gains. (See Figure 2.)
Still, the difference in salaries between master’s and bachelor’s degree graduates remains substantial. For the Class of 2024, the average starting salary for a master’s degree graduate is 23.5% higher than that of a bachelor’s degree graduate. The median salary for the master’s degree is 13.9% higher compared to the bachelor’s degree.
NACE’s First Destinations for the College Class of 2024 report examines what happened to 2024 graduates—from associate to doctoral degree graduates—within six months of graduation. The academic year for the Class of 2024 ran July 1, 2023, through June 30, 2024. Participating colleges and universities collected data through December 2024 for those who graduated in that timeframe. Overall, 363 institutions provided their outcomes data to NACE from January 6, 2025, through May 14, 2025. In total, the graduating classes of these reporting institutions represent approximately 823,500 graduates, including 571,500 at the bachelor’s degree level. To our knowledge, this represents the most comprehensive view of graduate outcomes currently available for the Class of 2024. The First Destinations for the College Class of 2024 report is available on NACEWeb.
* Career outcomes = Percent employed or enrolled in further education within six months of graduation.