National Association of Colleges and Employers
The report for the college Class of 2022 tells the story of what happened to graduates at the undergraduate and graduate levels—associate, bachelor’s, master’s, and doctorate—within six months of graduation.
Based on data provided by 344 schools, the report features data for:
The report includes outcomes by various forms of employment (full or part time, contract, temporary), additional education, entrance into the military or other service, still seeking (employment or additional education), and not seeking either employment or education. Average salaries by degree level are also included.
For bachelor’s and master’s degree graduates, the report also offers analysis into how the post-COVID market greeted them and how inflation affected their average starting salaries. The gender gap—in terms of employment and pay—is also explored.
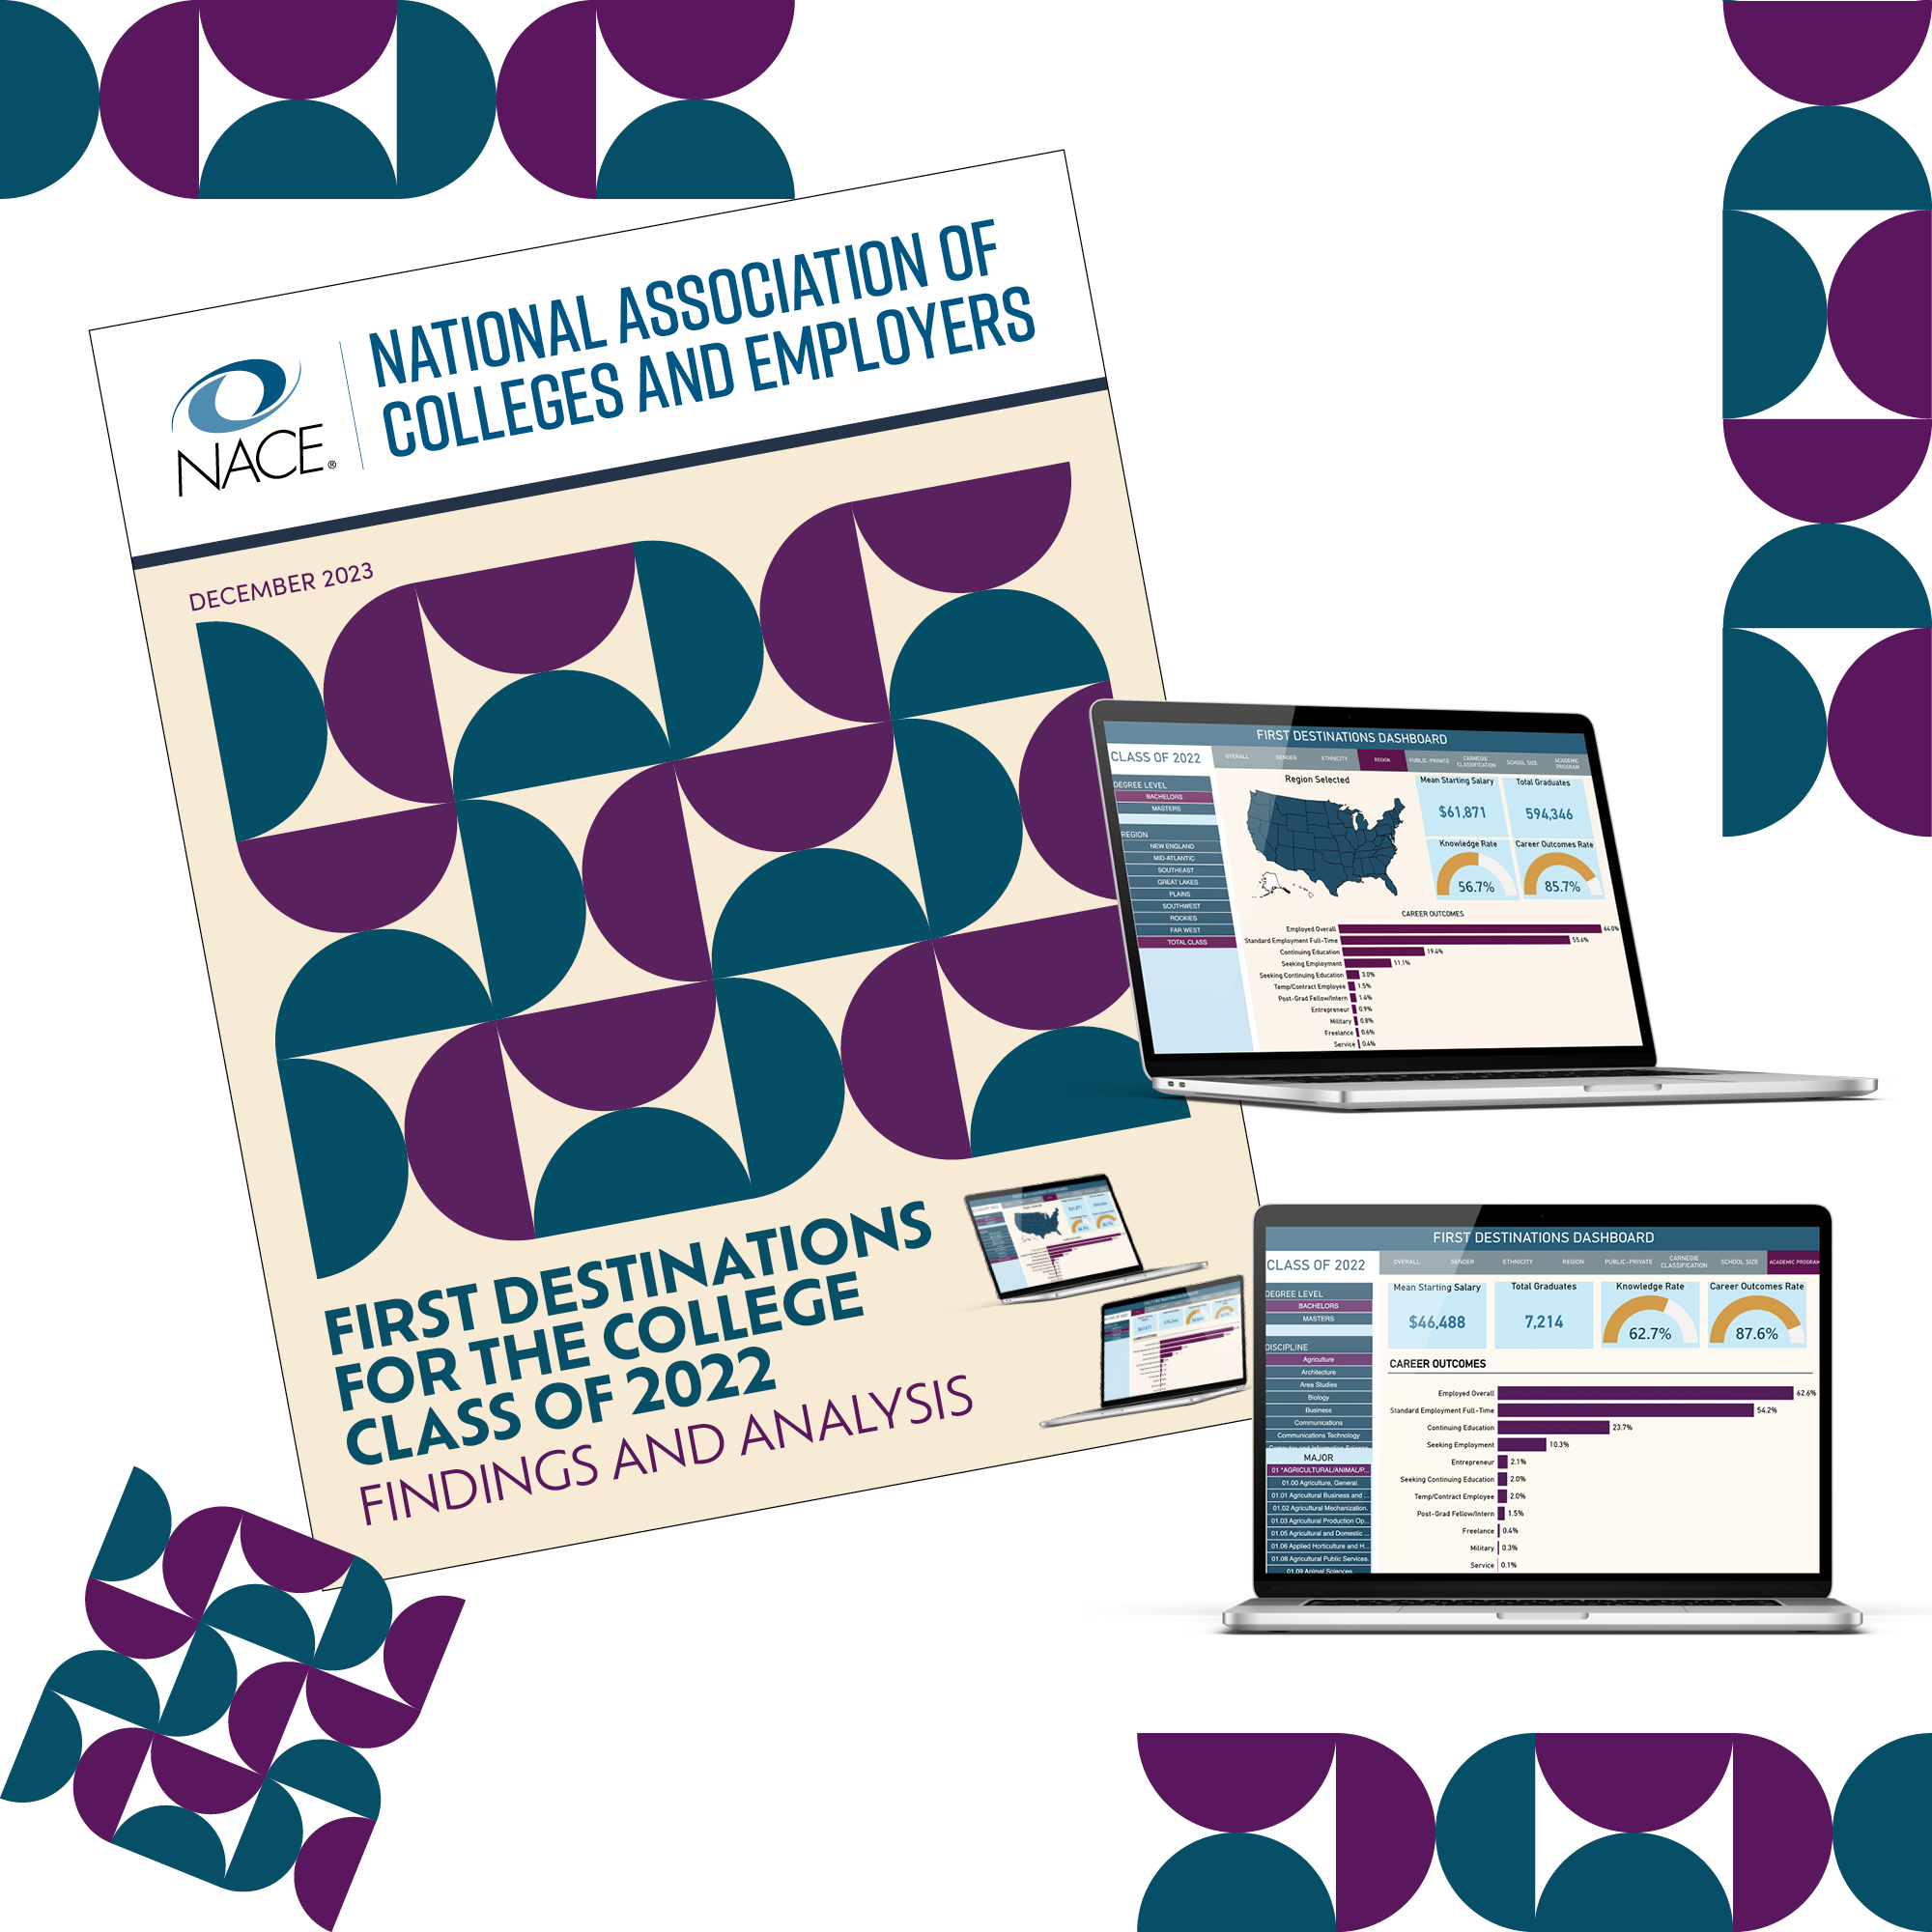
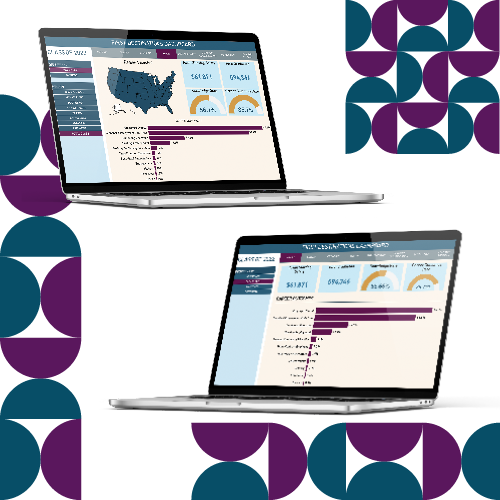
The dashboard allows you to filter and view data by: